Narrative

Introduction
The emergence of the COVID-19 pandemic caused unprecedented disruptions to education, especially for students across the United States. With the implementation of stay-at-home orders, closure of non-essential businesses, and school shutdowns in 2020 to mitigate the spread of the virus, over 1.2 billion students worldwide, including more than 90% of American students, were forced out of classrooms, urgently necessitating the adoption of remote E-learning methods.[2] This abrupt shift exacerbated existing educational inequalities, especially regarding access to crucial resources like free or reduced-price school lunches and digital technology. Our research, utilizing two datasets from the Stanford Education Data Archive (SEDA) containing information for various demographics on standardized test scores and socioeconomic status, seeks to analyze the impact of these disruptions on student academic performance from various racial/ethnic and socioeconomic backgrounds. We argue there is a direct tie between academic achievement and access for marginalized groups along these axes, and that inequalities by race/ethnicity and socioeconomic status occur in tandem to each other. Loss of access to school-provided food and digital resources during remote learning significantly worsened academic performance, particularly among economically disadvantaged, Black, and Hispanic students, as evident in student proficiency upon the return to in-person learning in 2022.
Literature on student learning during COVID-19 highlights the pandemic as exacerbating educational inequalities, especially among low-income and historically disadvantaged groups.[4] The emergency pivot to remote teaching intensified pre-existing disparities such as access to technology, internet connectivity, and socioeconomic support due to its rapid implementation. During the period of remote learning, the use of information and communication technology became required to participate effectively. However, the digital divide made this unfeasible for many students, as “10%, 25%, 23%, and 5% of White, Black, Hispanic, and Asian households with children ages 6-17 years old did not have a high-speed internet connection at home.”[5] Low-income and underrepresented students who had less access to additional digital learning resources faced more significant challenges during this transition and exhibited higher performance gaps compared to those who did not face economic disadvantages.[6] Further research also underscores the critical role of school food resources in improving academic performance and behavior, highlighting the benefits of free school meals. Universal Free meals have been shown to increase academic performance for all students.[7] Additionally, studies have indicated that receiving nutritious school meals gives rise to behavioral and emotional improvements that aid focus during learning.[8] However, disruptions to nutrition programs at the onset of the pandemic caused a reduction in number of school meals served during the initial months of COVID-19 and food insecurity to rise among vulnerable populations.[9]
Contradictions arise in some research noting the benefits of e-learning as increased retention of information and convenience, despite acknowledging barriers like the digital divide [10]. Moreover, some questions remain regarding the long-term academic benefits of free school lunch programs, despite recognizing their immediate nutritional contributions to low-income students and contribution to improved classroom behavior.[11]
Scholars generally agree that food inaccessibility and the digital divide disproportionately affect marginalized groups, particularly Black, Hispanic, and Indigenous students, who are also among the most medically vulnerable to COVID-19.[12] There is a need for further exploration into how students have adjusted to the transition back to in-person learning and the ongoing effects of the pandemic, including long-COVID and multiple re-infections, on student learning. These studies collectively affirm the disproportionate impact of the pandemic on marginalized communities and the essential role of access to educational and nutritional resources.
This project is crucial for understanding the long-term effects of pandemic-induced educational disruptions on marginalized groups. In analyzing the SEDA datasets, we address the underexplored question of how students, particularly those from disadvantaged backgrounds, have recovered academically since the return to in-person learning and the recovery of educational resources. This research connects to broader discussions on educational equity, emphasizing the need for equitable resource distribution to ensure all students have equal opportunities for academic success. Ultimately, our goal is to highlight the significant influence of access to resources on academic performance, advocating for policies that mitigate educational disparities and support vulnerable student populations. Through this work, we aim to contribute to a deeper understanding of inequalities in the education system and the urgent need for solutions to bridge these gaps.
How was student learning in the United States impacted by remote learning during the pandemic?

This choropleth map of the United States represented in Figure 1 was made in Tableau using data from SEDA 2023. Within this map, the extent of test score change from 2019-2022 is shown through a scale of color. In this scale, 0 represents the 2019 NAEP national test score mean. One unit represents one student-level standard deviation from the mean. Blue indicates a positive test score change and orange a negative change, with darker colors indicating a severe change in student performance and lighter colors indicating less change. Data on specific values for these changes can be seen by hovering over each state. This map relates to our research since it visualizes the impact of the pandemic on student learning as students lost access to resources such as free or reduced-price lunch during the period of remote learning.
As shown on the map, the vast majority of states appear to be orange in color, displaying a decrease in student performance from 2019–2022. Alabama, appearing as gray-blue on the map, is the only state revealed to have increased student performance during this period, although only by a small measure change of 0.053. The largest decrease in student performance occurred in Maryland (-3.054).
The transition to remote learning left schools with little time to reshape policy or form strategies to accommodate for the change.[13] Most school curriculum had been designed to be delivered in person, leaving both instructors and students unprepared. Changes involved the adoption of digital programs such as Zoom and Google Classroom. Students were challenged by a combination of factors including stress and anxiety from the pandemic, variations in state government responses to Covid-19, new teaching strategies and assessments, the closing of resource centers such as libraries and learning centers, as well as a variety of difficulties relating to problems with technology, engagement, changes in responsibility, and self-motivation.[14] Overall learning experience for individuals was determined largely by their sociocultural context.[15]
Insights from Figure 1 into test score changes from 2019 to 2022 indicate that the transition to remote learning during the pandemic did have a significant, wide-scale negative impact on student learning. This contributes to our investigation into how changes in school structuring during the initial years of the pandemic influenced student learning as test scores are shown to have worsened nationally in comparing levels from before the onset of the pandemic to when schools had recently returned to in-person format.
We attribute the nationwide worsening of academic performance to the exacerbation of pre-existing racial and economic disparities in education as well as structural under-resourcing issues.[16] The extent to which individual states were affected varies due to an interplay of demographic, public health, political, and educational factors. One of the most significant predictors of educational success is a student’s social class.[17] As a result of this, large and persisting performance gaps exist between children in low and high-socioeconomic status households. These academic gaps are representative of the access issues and unfulfilled needs disadvantaged children experience.
Socioeconomic status accounts for six standardized indicator variables: “measures of median family income, proportion of adults with a bachelor’s degree or higher, proportion of adults that are unemployed, household poverty rate, the proportion of households receiving Supplemental Nutrition Assistance Program (SNAP) benefits, and the proportion of households with children that are headed by a single mother.”[18]
Disparities in socioeconomic status are implicated in the digital divide. The majority of school-age children who do not have high-speed internet connections belong to low-income households.[19] The inequality in access to digital technology worsened during the remote-learning period of the pandemic since personal technology for communication and accessing information was required, but students without access to computers and the internet were not fully accommodated. In a 2021 survey, “approximately 46% of children from low-income households were reported to experience technology obstacles, compared to 31% of children from mid-range income and 18% of children from high-income households.”[20]
Is reliance on school resources connected to socioeconomic status?

Figure 2 displays a line graph made in Tableau using data from SEDA 5.0. This visualization tracks the percentage of students enrolled in free or reduced-price lunches by the average socioeconomic status of students in states. The percentage for free or reduced-price lunch is shown on the y-axis while the x-axis measures average socioeconomic status. On the x-axis, 0 represents the enrollment-weighted mean, while one unit is equal to one standard deviation. This chart examines pre-pandemic levels, averaging the years 2005-2018.
As seen in this visualization, there is an inverse relationship between socioeconomic status and the percentage of students benefiting from free or reduced-price lunch. This means that states with higher socioeconomic status have less students enrolled in free or reduced-price lunch. States with lower socioeconomic status see more enrollment in free or reduced-price lunches.
This visualization connects to our research as it explains why economically disadvantaged students were affected by the loss of access to student food resources during the pandemic more than students who had higher socioeconomic status. In the United States, the USDA National School Lunch and School Breakfast programs play a major role in providing economically disadvantaged school-aged children with a large percentage of their daily dietary needs, providing food security, and maintaining nutritional health.[21] Prior to the pandemic, approximately 15-30 million children belonging to households at or below 185% of the poverty level benefitted annually from these nutrition programs. However, school closings in 2020 led to program disruptions, leaving many economically disadvantaged children to get their meals at home when they had previously been receiving the majority of their dietary intake in school settings. Despite efforts to stabilize these programs and increase access, national meals served by the Spring of 2020 compared to 2019 decreased by 28% and food insecurity increased.[22]
How does this connect to racial disparity?
SES
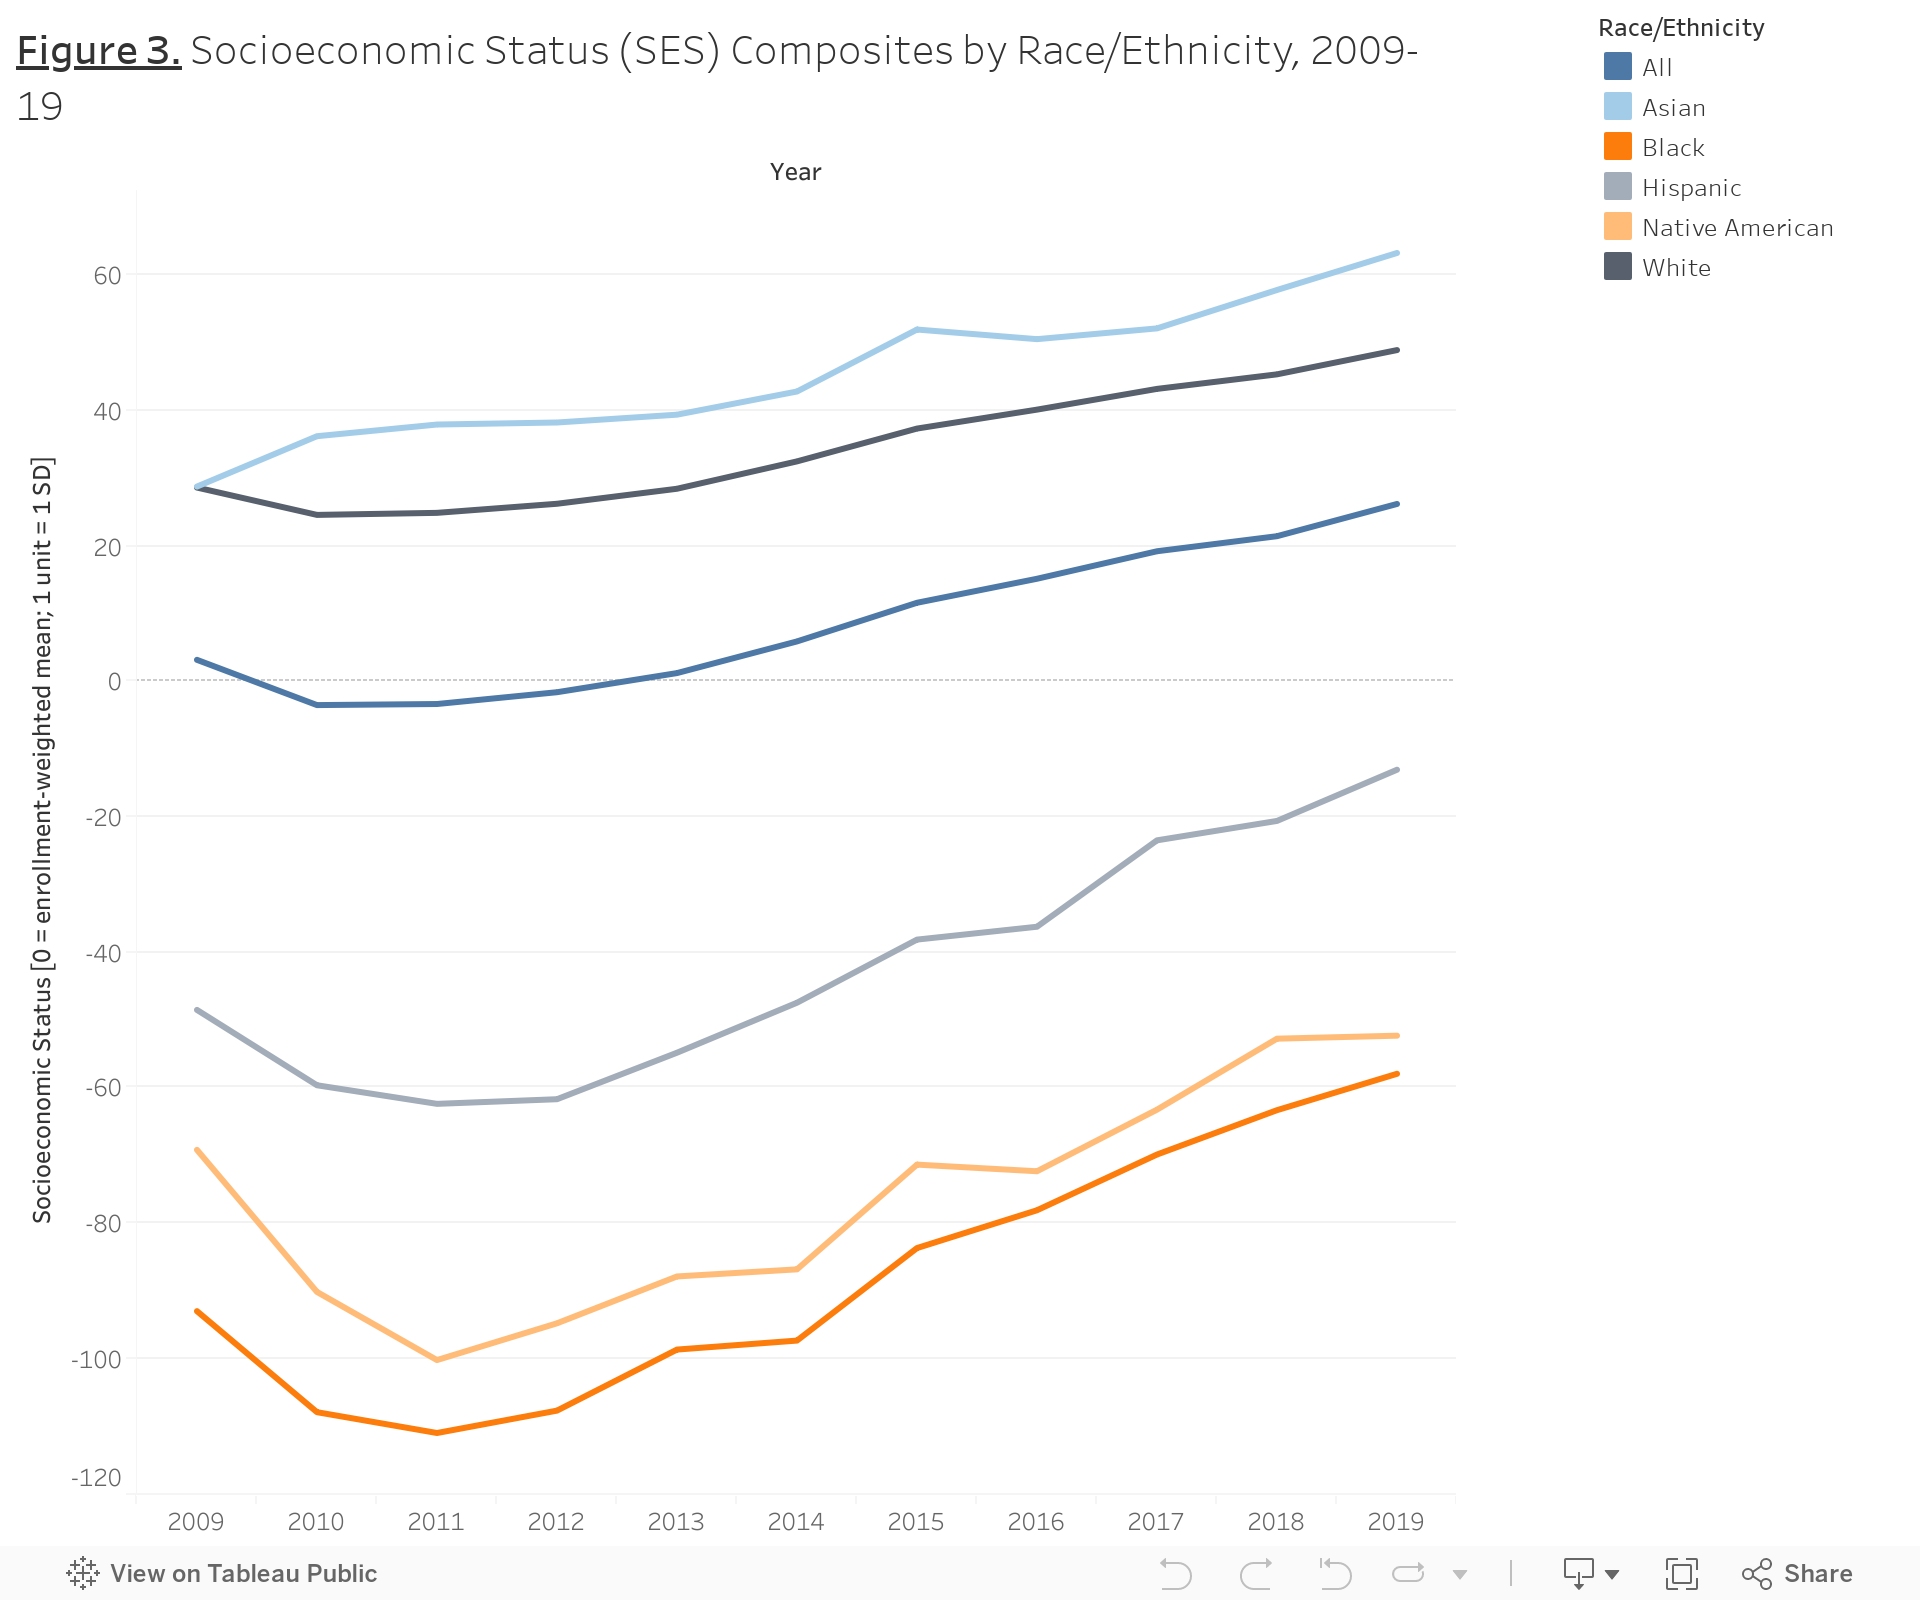
The line chart shown in Figure 3 was made in Tableau with data from SEDA 5.0. This visualization tracks the Socioeconomic Status (SES) composites for students from 2009-2019 by race/ethnicity. The y-axis measures socioeconomic status, with the enrollment-weighted mean representing 0 and one unit equal to one standard deviation. The year is shown on the x-axis. The groups represented within the line chart are Asian, Black, Hispanic, Native American, and White students. The trend for each group is shown by a specific color line. There is an additional line representing all students. This chart examines the decade before the pandemic to examine whether SES trends for each group are historically consistent. The dataset used does not include information for years under the scope of the pandemic.
As seen in the visualization, trends for all races/ethnicities dipped slightly around 2011-2012 and then gradually rose until 2019. The trends for each race/ethnicity remained consistent in their relative positions. Asian and White students had the highest SES scores, remaining above the trend representing all students. Black, Hispanic, and Native American students had the lowest SES scores, registering below the trend for all students. Scores for Asian students consistently remained at the top while Black students consistently had the lowest scores.
SNAP
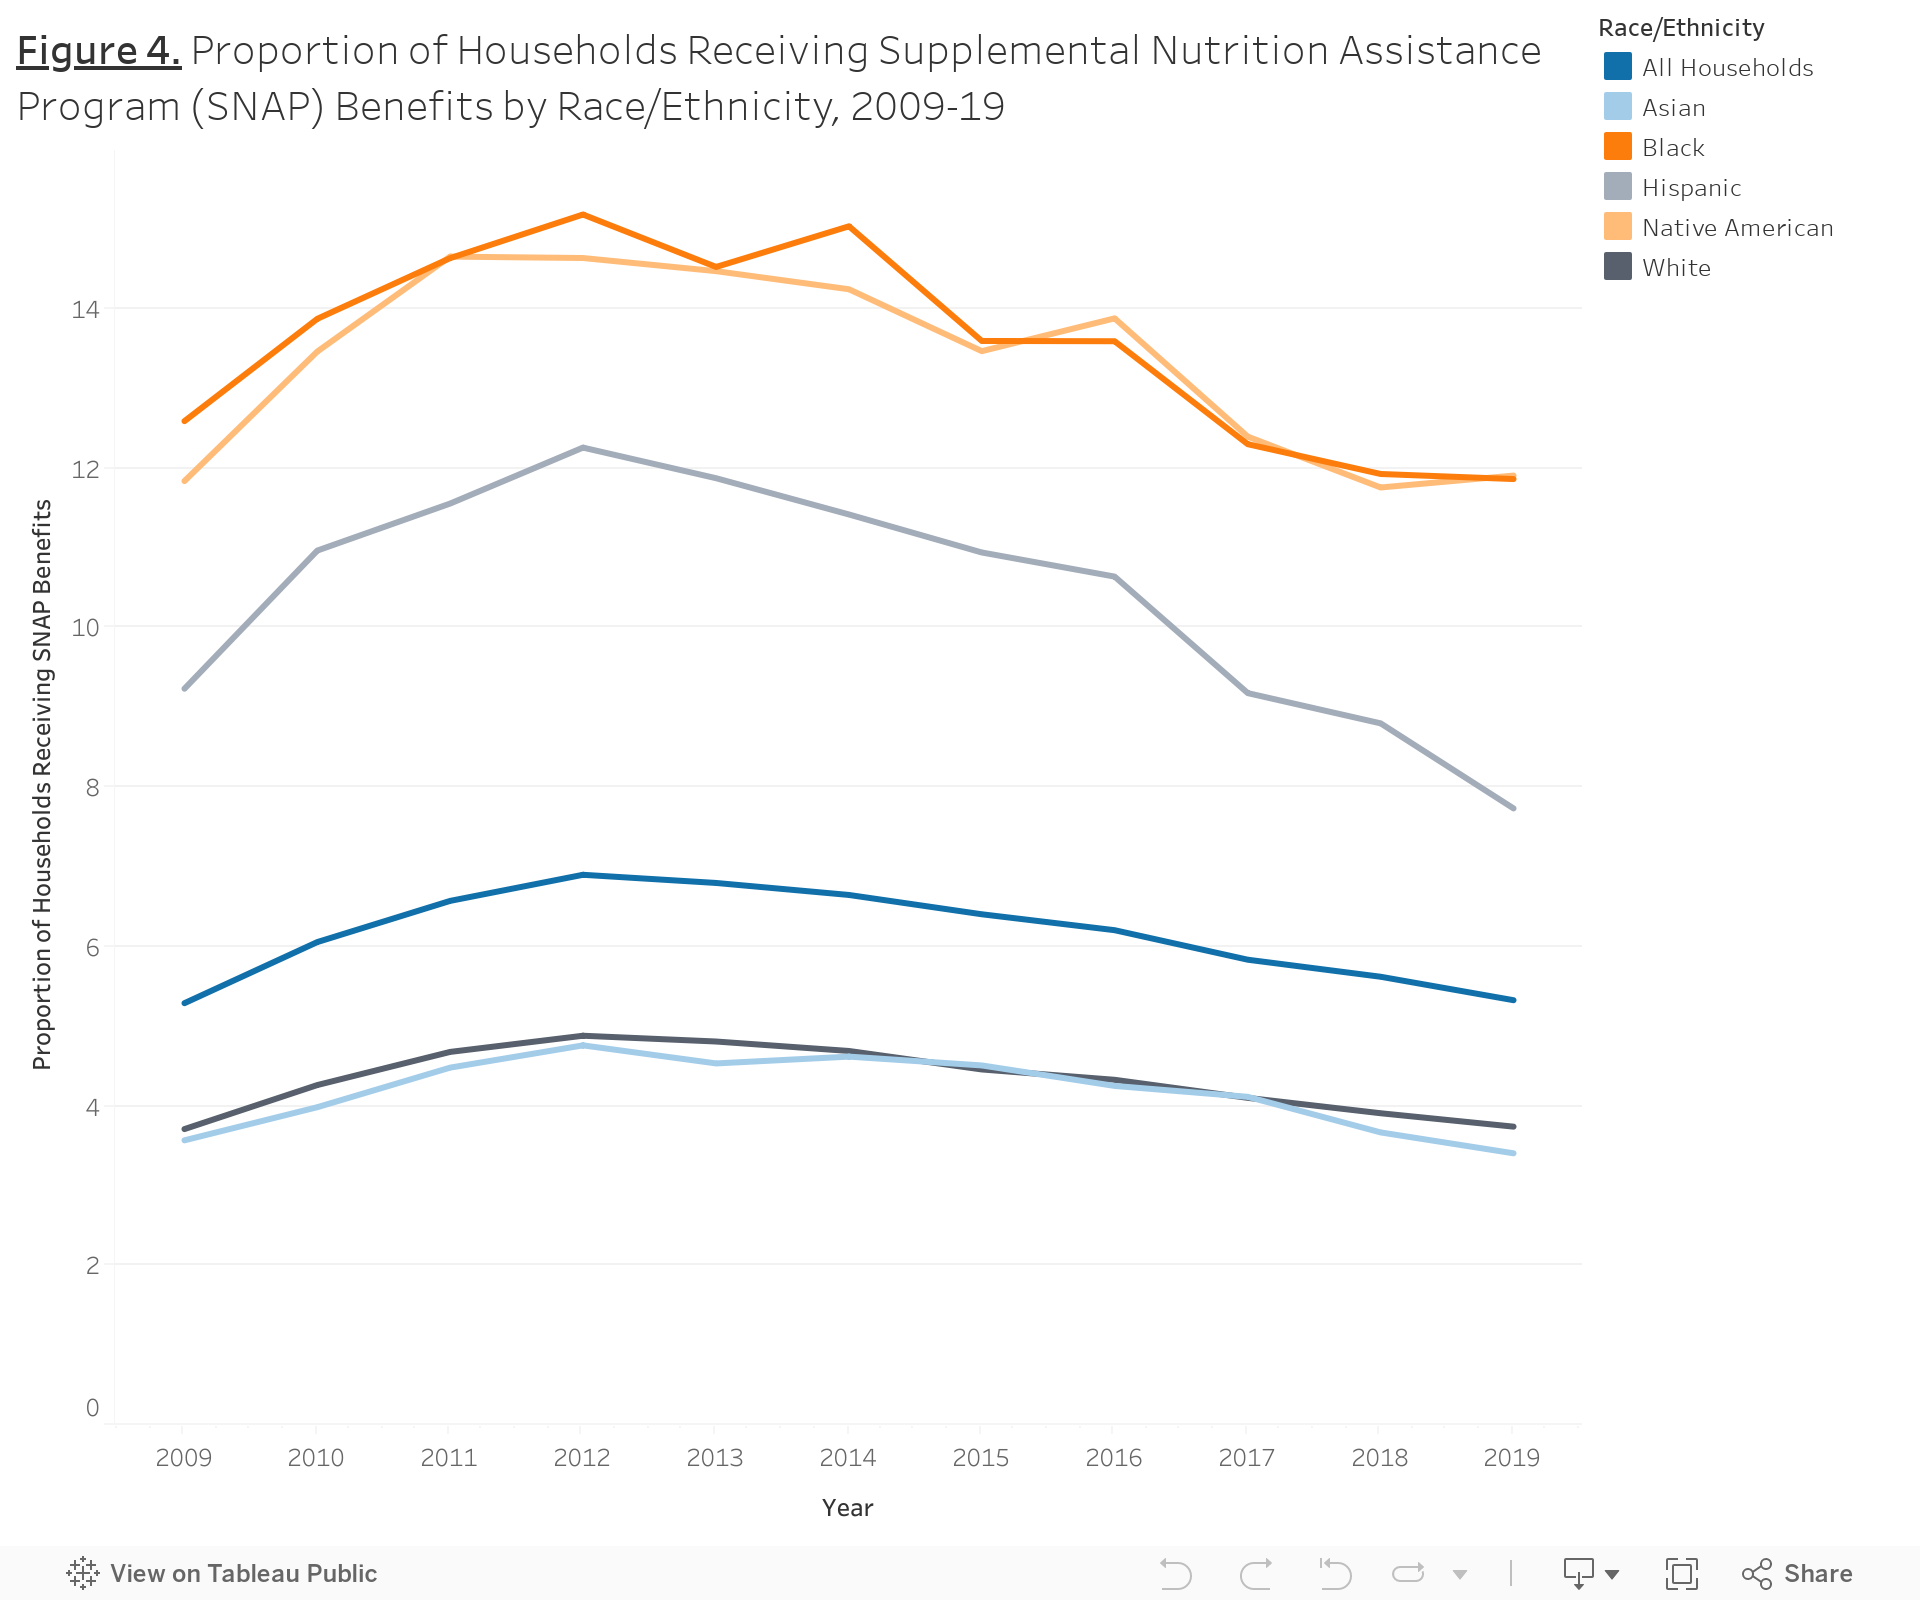
The line chart in Figure 4 was made in Tableau using data from SEDA 5.0. This visualization tracks the proportion of households receiving Supplemental Nutrition Assistance Program (SNAP) benefits from 2009-2019 by race/ethnicity. The proportion of households receiving these SNAP benefits is measured on the y-axis while the x-axis shows the year. The groups represented within the line chart are Asian, Black, Hispanic, Native American, and White households. The trend for each group is shown by a specific color line. There is an additional line representing all households. This chart examines the decade before the pandemic to examine whether trends for food assistance for each group are historically consistent. The dataset used does not include this information for years under the scope of the pandemic.
As seen in the visualization, trends for all races/ethnicities peaked around 2012 and fell slightly until 2019, although they remained consistent in their relative positions. It can be observed that the trends for Black, Native American, and Hispanic households enrolled in SNAP are above the trend representing all households. Black and Native American households are shown to benefit the most from SNAP. The trends for Asian and White households remain less than the one representing all households, indicating low enrollment in SNAP compared to other groups.
The line charts in Figures 3 and 4 show that socioeconomic status is directly correlated with SNAP enrollment. Black, Hispanic, and Native American populations see the lowest average socioeconomic status and therefore, the highest SNAP enrollment. White and Asian populations have the highest socioeconomic status and therefore the lowest SNAP enrollment. As those enrolled in SNAP are eligible for free or reduced-price school lunches, the inverse relationship between nutrition program enrollment and socioeconomic status from Figure 2 is shown to be maintained here.
These charts relate to our research as they show the intersectionality between race/ethnicity and socioeconomic status in the context of reliance on nutrition assistance programs. BIPOC groups who have historically faced institutional discrimination displayed the lowest socioeconomic status and highest enrollment in SNAP, apart from Asians. These two categories of identity interact to form intersecting forms of inequality/privilege that work jointly rather than distinctly. For example, there is shown to be an overlap between economically disadvantaged students and Black, Hispanic, and Native American students in those who experience higher rates of food insecurity. USDA estimates show that in 2020, food insecurity was higher for subpopulations including households that are Black, Hispanic, have both children and adults, or experience higher rates of poverty.[25] This compounded inequality holds true for the digital divide as well, as the rates of digital access are lower for both students of low-income households and students of color.[26] Access to technology is highest among Asian and White students, followed by Hispanic students, then Black.[27] It is also notable that Black and Hispanic populations faced higher death and unemployment rates resulting from Covid-19.[28]
Are there disparities in how students of different economic and racial backgrounds responded to remote learning and the return to in-person?
Economic Status
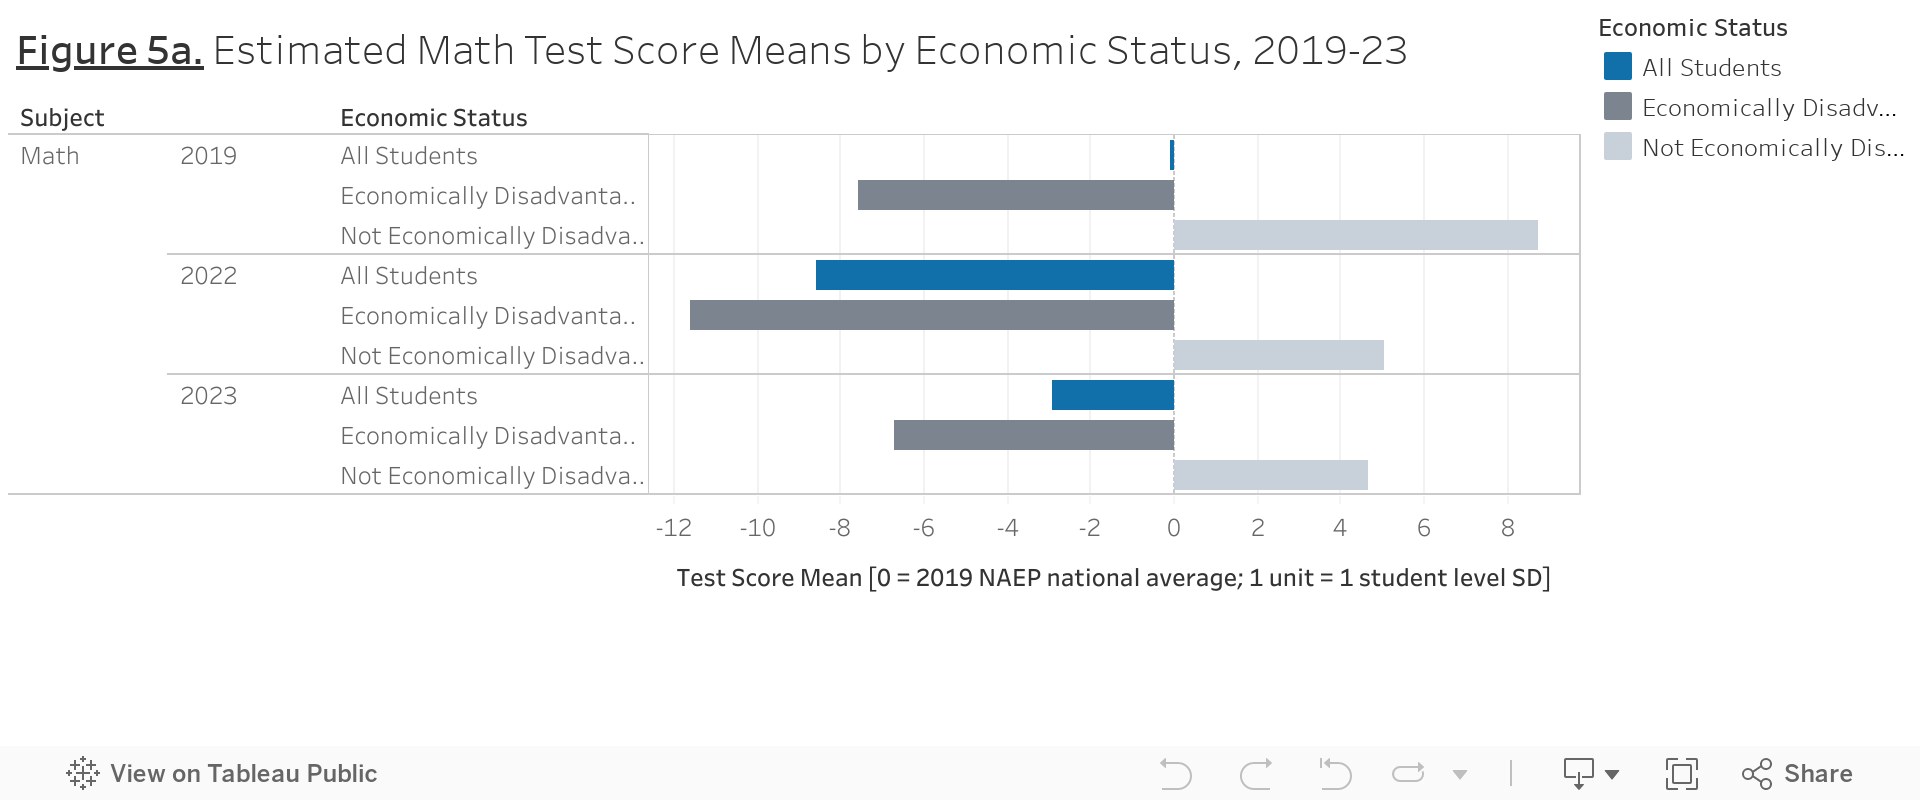
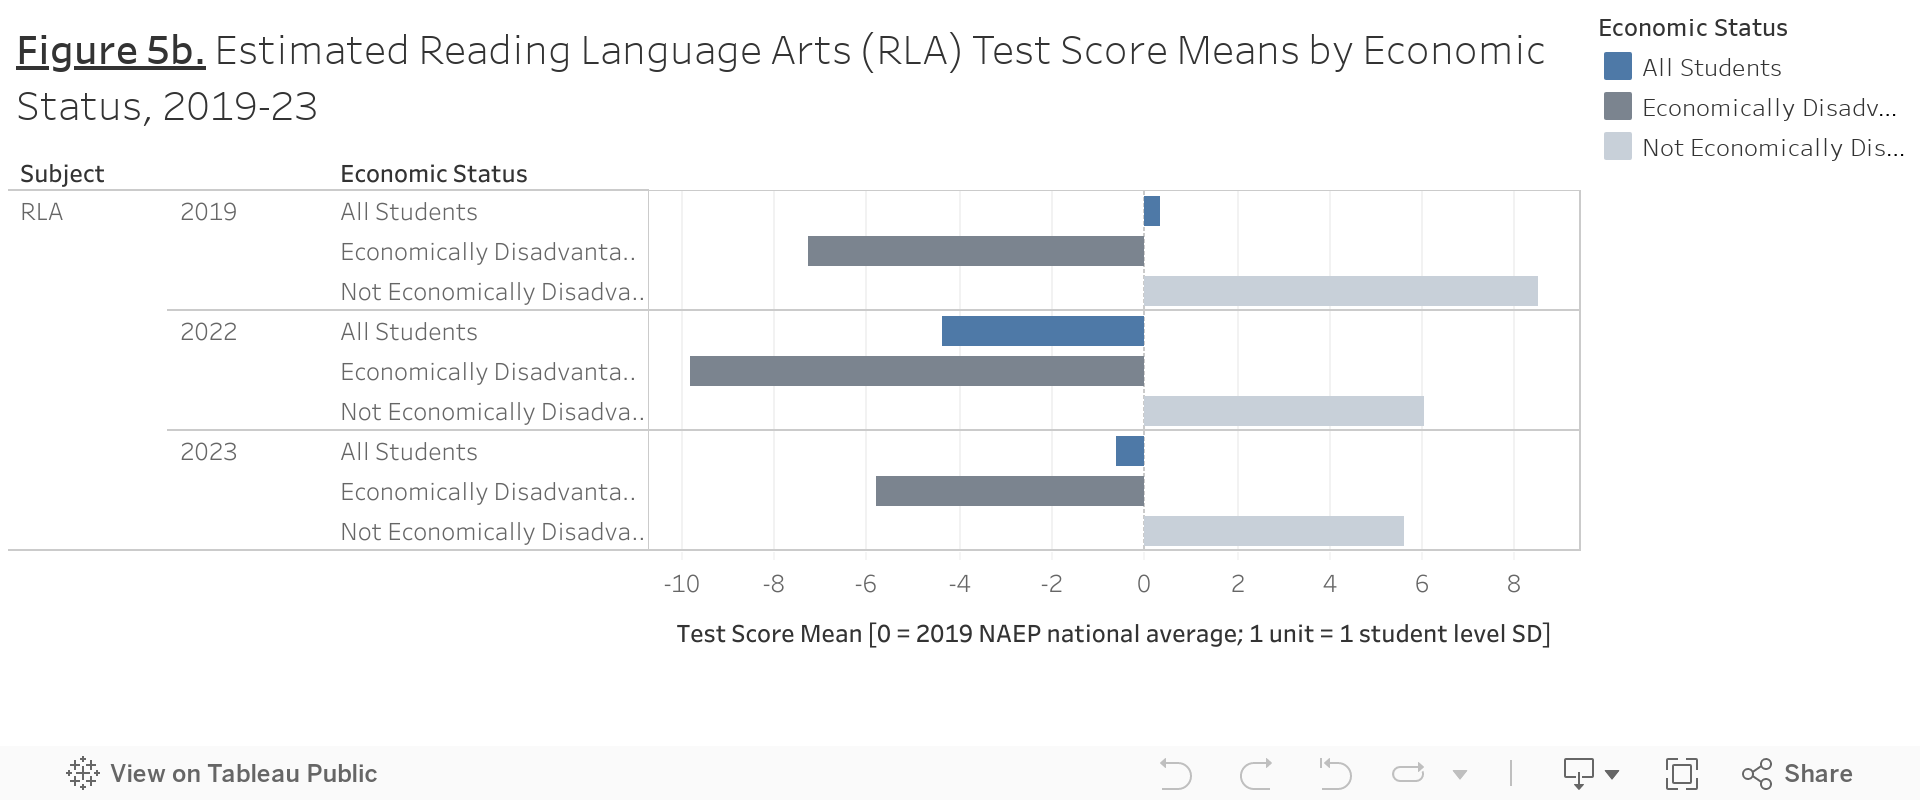
The side-by-side bar charts shown in Figure 5a and 5b were made in Tableau with data from SEDA 2023. They show the estimated test scores for math and reading language arts respectively in 2019, 2022, and 2023 by economic status. The dataset used does not include information for years 2020 or 2021 due to limited testing. The demographics examined, represented by different colored bars, are economically disadvantaged students and not economically disadvantaged students. There are additional bars representing all students. Year and economic status are on the y-axis while the x-axis represents test score means, with each unit equal to one student-level standard deviation. As this is interval data, x=0 represents the 2019 NAEP national test score average. This chart uses this value to represent 0 to be able to compare student performance under the scope of the pandemic to pre-pandemic levels. Showing this data side-by-side in separate bars within distinct year categories makes it easier to compare the values of each economic group to each other in the same year and also compare multiple years to each other. The use of a horizontal format allows viewers to see and compare the extent to which demographics fall behind and ahead of the national average (x=0).
We found test score mean distributions to be similar across academic subjects, with only a few differences. The bars representing all students in the United States place test score mean in 2019 slightly behind the 2019 NEAP national average in math (-0.09) and slightly ahead in reading language arts (0.34). In both subjects, all students saw a significant decrease of their test score mean in 2022 and a recovery of test scores in 2023, although both measures are behind 0.
The visualization also depicts the persistent achievement gaps between students of different economic statuses. Regardless of the subject, economically disadvantaged students consistently tested behind the 2019 NAEP national average and behind test score estimations representing all students for all years examined. Students who were not economically disadvantaged remained ahead of the 2019 NAEP national average for all years. While non-economically disadvantaged students saw a gradual decrease in test score means for both math and reading language arts from 2019 to 2023, mean values for economically disadvantaged students provide a unique insight. For both subjects, economically disadvantaged students also saw a decrease in test score means from 2019 to 2022. This was a change of -4.01 units in math and -2.56 in reading language arts. However, from 2022 to 2023, these students saw a unique recovery of their test scores by a significant margin. For math, this was a change of +4.88 units, and for reading language arts +4.01 units.
Race/Ethnicity
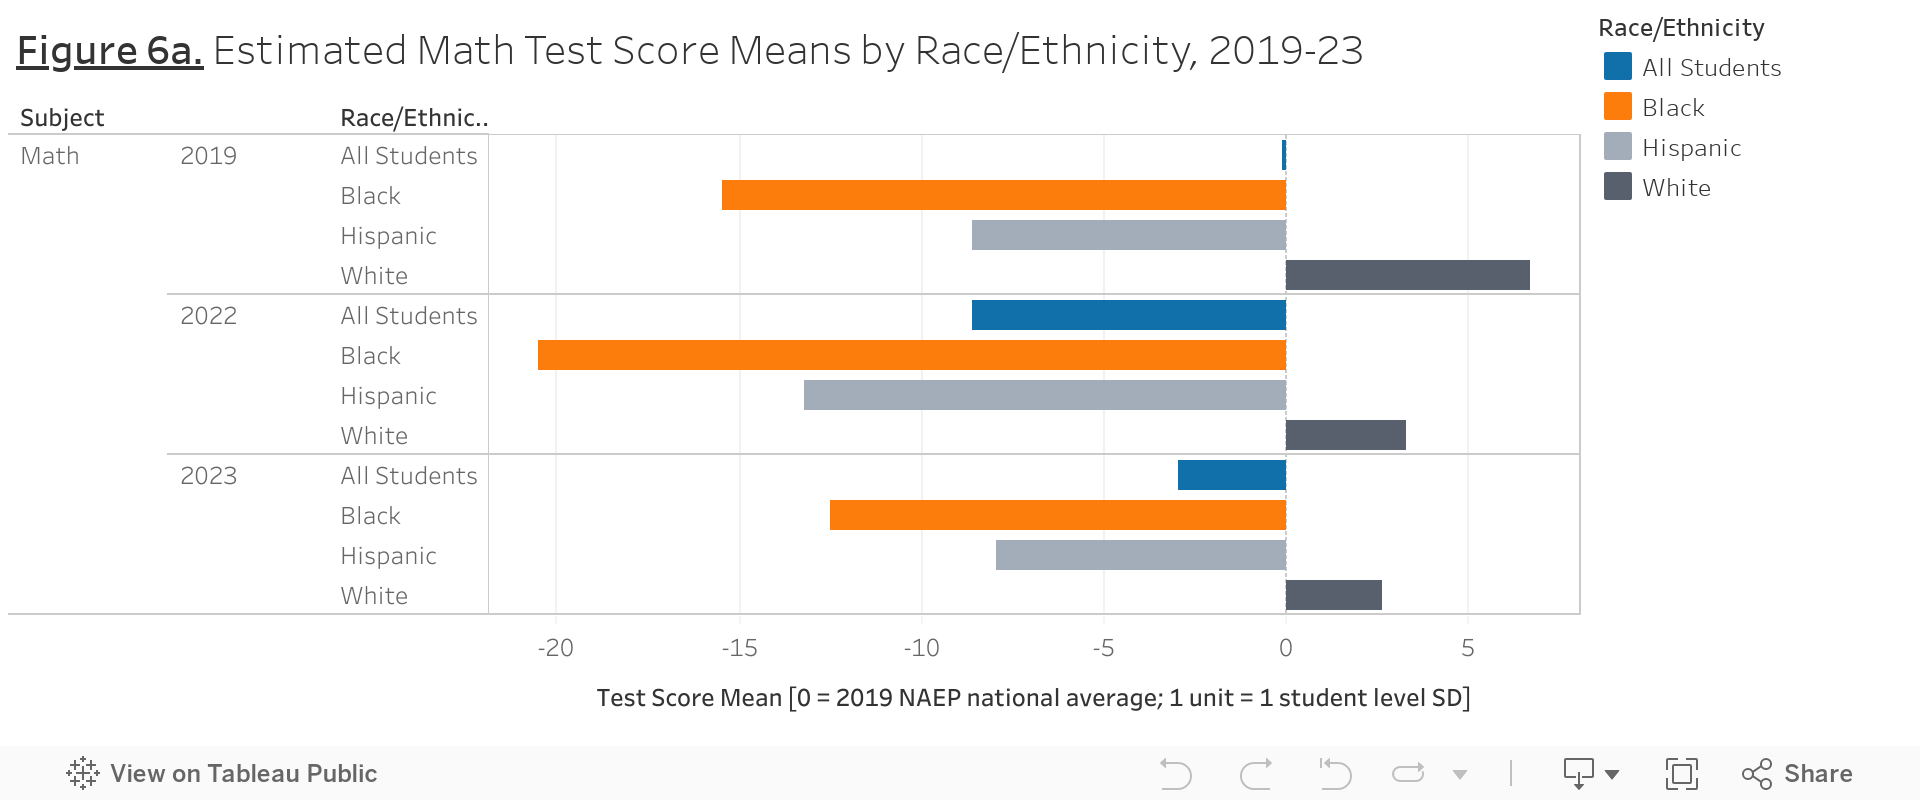
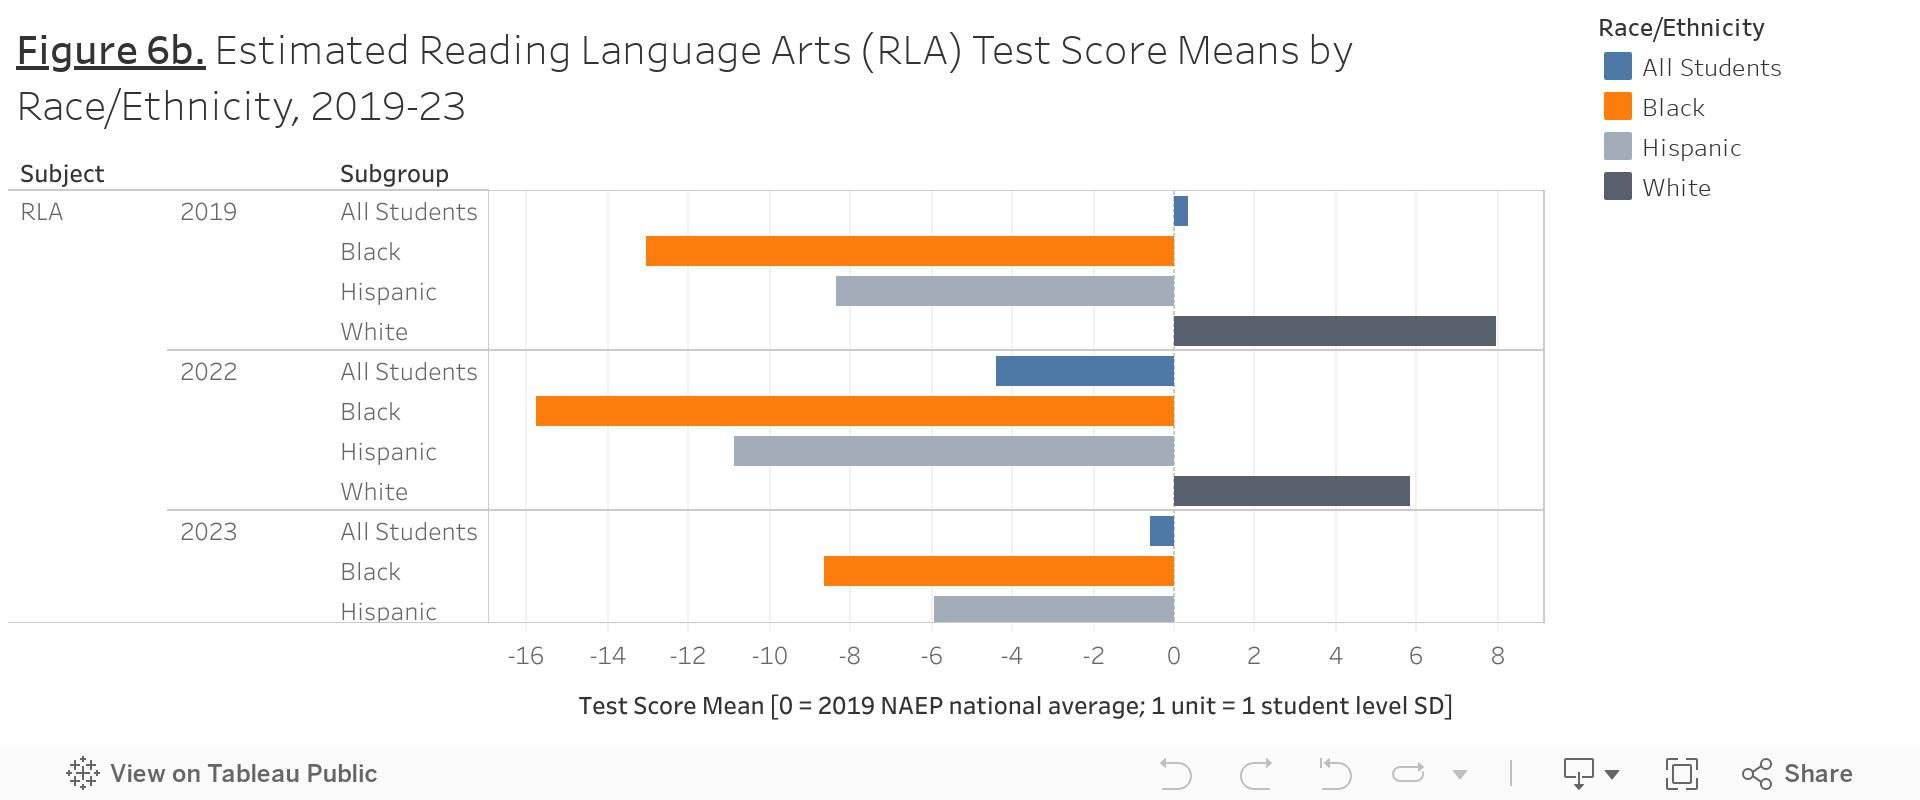
The side-by-side bar charts shown in Figure 6a and 6b were made in Tableau with data from SEDA 2023. They depict the estimated test scores for math and reading language arts respectively in 2019, 2022, and 2023 by race/ethnicity. Due to limited testing during the initial years of the pandemic, the dataset used does not include information for 2020 or 2021. The demographics examined, represented by different color bars, are Black, Hispanic, and White students. There are additional bars representing all students. The dataset used does not include information regarding Asian or Native American students. Year and economic status are on the y-axis while the x-axis represents test score means, with each unit equal to one standard deviation. On the x-axis, 0 represents the 2019 NAEP national test score average. This value is used to represent 0 in order to compare student academic performance during the initial years of the pandemic to pre-pandemic levels. Depicting this data side-by-side in separate bars within these distinct year categories makes it easier to compare the values of each racial/ethnic group to each other in the same year as well as multiple years to each other. A horizontal format allows viewers to see and compare the extent to which demographics fall behind and ahead of the 2019 NAEP national average (x=0).
We found test score mean distributions to be similar across academic subjects, with few differences. Bars representing all students in 2019 have measures close to x=0, with a value of -0.09 for math and 0.34 for reading language arts. In both subjects, these bars fell behind 0 in both 2022 and 2023, although in 2023 student performance did improve from the year prior.
Figures 6a and 6b reveal the persisting achievement gaps between racial/ethnic groups. In both math and reading language arts, Black students had the lowest performance while White students had the highest. Regardless of subject, both Black and Hispanic Students consistently remained behind the 2019 NAEP national average and also performed behind the bars representing all students for all years examined. White students tested ahead of the 2019 NAEP national average for all years. While white students saw a gradual decrease in test score means for both math and reading language arts from 2019 to 2023, changes in test score means for Black and Hispanic students differed. For both subjects, Black and Hispanic students saw a significant decrease in test score mean from 2019 to 2022. In math, this change was -5.06 units for Black students and -4.85 for Hispanic students. In reading language arts, -2.72 for Black students and -2.52 for Hispanic students. However, from 2022 to 2023, these students saw a recovery of their test scores similar to that of economically disadvantaged students seen in Figures 3a and 3b. In the subject of math, this change was +8.01 units for Black students and +5.24 units for Hispanic students. In reading language arts, there was a change of +7.31 units for Black students and +4.93 units for Hispanic students.
Insights from comparing Figures 5 and 6 suggest that the transition to and from remote learning during the initial years of the pandemic, and the subsequent lack and recovered access to resources, did affect student academic performance. Students who are economically disadvantaged, Black, and Hispanic saw similar gaps in achievement compared to White and not economically disadvantaged students. While non-disadvantaged and White students saw a gradual decrease in academic performance for all years, economically disadvantaged, Black, and Hispanic students responded both to the period of remote learning and the return to in-person learning. This supports our argument that student performance for marginalized racial and socioeconomic groups is directly tied to access and that disparities for these groups do not occur independently of one another. Students who relied more on school-provided technology and free or reduced-price school lunch experienced a decrease in test score mean in 2022 directly following the period of remote learning in which they lost access, and then in 2023 experienced an increase in test score mean after an extended period of returned access. Student groups who did not rely as much on access to school resources did not see any improvement in academic performance with the return of access.
Conclusion
This project is an effort to understand the long-term effects of educational disruptions at the beginning of the pandemic on marginalized socioeconomic and racial groups through an intersectional lens. The abrupt and unprecedented nature of remote learning had wide-scale, negative impacts on national academic performance. Existing educational inequalities were exacerbated, especially those involving access to school technology and nutritional resources. Our research found that students from disadvantaged socioeconomic and racial backgrounds, including economically disadvantaged, Black, and Hispanic students, experienced compounding disparities in access to these resources compared to students who were not economically disadvantaged and White. In examining academic performance before the pandemic, directly after the return to in-person learning, and after an extended period of in-person learning, it was shown that these marginalized groups experience persistent academic gaps compared to nonmarginalized students and that their academic performance responded directly to periods in which they did and did not have access to school resources.
Our research into the connections between academic performance and access connects to broad discussions about educational equity and highlights the need for equitable resource distribution to bridge academic gaps. We acknowledge that our data is incomplete and contains exclusions, although we believe that analyzing and contextualizing this data is important in making information about educational inequity accessible. Through our work, we advocate for policies that expand internet connectivity as well as those that support the provision of computers for students to use at home to combat the digital divide.[30] To combat disparities in food security, we advocate for universal school meals, which are associated with increases in meal participation, food security, nutrition, and academic performance.[31] We also urge consideration of meal site placement with the density of priority populations to close access gaps caused by food deserts.[32] We hope that access to information regarding inequalities in the education system and academic gaps prompts solutions that ensure all students have equal opportunities for academic success.
1. Chris Ryan, “Elevated View of Students Writing Their GCSE Exam,” iStock, December 31, 9999, https://www.istockphoto.com/photo/elevated-view-of-students-writing-their-gcse-exam-gm525409577-525409577.
2. Eesha Sharma, “Impact of Covid -19 on Education: Rise of Elearning,” International Journal of Social Relevance & Concern 9, no. 2 (February 15, 2021): 106, https://doi.org/10.26821/IJSRC.9.2.2021.9229.
3. Van Buren School District, “Cafeteria Workers Serve Elementary Students in the Van Buren School District Lunch,” Fort Smith Times Record, 2021, https://www.swtimes.com/gcdn/presto/2021/10/11/NTRE/b7fc7a81-a3cf-43ee-8e12-3b7535a5564c-cafeteria_workers.jpeg?width=660&height=495&fit=crop&format=pjpg&auto=webp.
4. Laura Czerniewicz et al., “A Wake-Up Call: Equity, Inequality and Covid-19 Emergency Remote Teaching and Learning,” Postdigital Science and Education 2, no. 3 (October 1, 2020): 947–48, https://doi.org/10.1007/s42438-020-00187-4.
5. Kolawole Ogundari, “Student Access to Technology at Home and Learning Hours during COVID-19 in the U.S,” Educational Research for Policy and Practice (May 12, 2023): 2, https://doi.org/10.1007/s10671-023-09342-7.
6. Carla Haelermans et al., “Sharp Increase in Inequality in Education in Times of the COVID-19-Pandemic,” PLoS ONE 17, no. 2 (February 2, 2022): 2, https://doi.org/10.1371/journal.pone.0261114.
7. Amy Ellen Schwartz and Michah W. Rothbart, “Let Them Eat Lunch: The Impact of Universal Free Meals on Student Performance,” Journal of Policy Analysis and Management 39, no. 2 (March 2020): 376, https://doi.org/10.1002/pam.22175.
8. Priscilla Blossom, “What are the benefits of free school meals? Here’s what the research says,” Food Science and Human Nutrition (University of Illinois Urbana Champaign, October 17, 2023), https://fshn.illinois.edu/news/what-are-benefits-free-school-meals-heres-what-research-says#:~:text=Experts%20say%20that%20providing%20free,meals%20during%20the%20school%20day.
9. Sarah Dhillon and Lily Reisinger, “Disrupted Food Supply Chain’s Effect on School Nutrition Programs’ Ability to Meet USDA Nutritional Guidelines During the COVID-19 Pandemic,” Journal of Child Nutrition Management 46, no. 2 (Fall 2022): 2, https://schoolnutrition.org/journal/fall-2022-disrupted-food-supply-chains-effect-on-school-nutrition-programs-ability-to-meet-usda-nutritional-guidelines-during-the-covid-19-pandemic/.
10. Sharma, “Impact of Covid -19 on Education.” 108.
11. D. Gietzen and J. A. Vermeersch, “Health Status and School Achievement of Children from Head Start and Free School Lunch Programs,” Public Health Reports (Washington, D.C.: 1974) 95, no. 4 (1980): 362–63, https://www.ncbi.nlm.nih.gov/pmc/articles/PMC1422538/.
12. Suchitra Rao et al., “Postacute Sequelae of SARS-CoV-2 in Children,” Pediatrics 153, no. 3 (March 1, 2024): 1, https://doi.org/10.1542/peds.2023-062570.
13. A. M. Aramati Casper et al., “The Impact of Emergency Remote Learning on Students in Engineering and Computer Science in the United States: An Analysis of Four Universities,” Journal of Engineering Education 111, no. 3 (2022): 704, https://doi.org/10.1002/jee.20473.
14. Casper et al., “The Impact of Emergency Remote Learning on Students in Engineering and Computer Science in the United States,” 705.
15. Casper et al., “The Impact of Emergency Remote Learning on Students in Engineering and Computer Science in the United States,” 711.
16. Clea Simon, “How COVID Taught America about Inequity in Education,” Harvard Gazette, July 9, 2021, https://news.harvard.edu/gazette/story/2021/07/how-covid-taught-america-about-inequity-in-education/.
17. Emma García and Elaine Weiss, Economic Policy Institute, Education Inequalities at the School Starting Gate (September 27, 2017), https://www.epi.org/publication/education-inequalities-at-the-school-starting-gate/#epi-toc-20.
18. Reardon Sean et al., “Stanford Education Data Archive Technical Documentation (Version 5.0),” Stanford Digital Repository (March 2024): 39, https://doi.org/10.25740/cs829jn7849.
19. Ogundari, “Student Access to Technology at Home and Learning Hours during COVID-19 in the U.S.,” 444.
20. Ogundari, “Student Access to Technology at Home and Learning Hours during COVID-19 in the U.S.,” 445.
21. Dhillon and Reisinger, “Disrupted Food Supply Chain’s Effect on School Nutrition Programs’ Ability to Meet USDA Nutritional Guidelines During the COVID-19 Pandemic,” 2.
22. Kaela Plank et al., “School Meal Access and Changes in Meal Participation during COVID-19 School Closures: A Stratified Random Sample of CalFresh Healthy Living Eligible School Districts in California,” Preventive Medicine Reports 28 (August 1, 2022): 2, https://doi.org/10.1016/j.pmedr.2022.101794.
23. Lori Higgins, “Students in Kenya Posey’s classroom at Davidson Elementary-Middle School rush to back up their conclusions about a novel they’re reading,” Detroit Free Press, 2019, https://www.freep.com/gcdn/presto/2019/03/21/PDTF/b5717725-b77f-46b4-9246-79140dbd8db2-Curriculum2.jpg?width=660&height=495&fit=crop&format=pjpg&auto=webp.
24. Rick Loomis, “Children from the Cesar Chavez Elementary School Eat Lunch on a Day…,” Getty Images, July 21, 2015, https://www.gettyimages.com/detail/news-photo/children-from-the-cesar-chavez-elementary-school-eat-lunch-news-photo/566039733.
25. Carmen Byker Shanks et al., “Disparities in Dietary Practices during the COVID-19 Pandemic by Food Security Status,” Preventive Medicine Reports 28 (August 1, 2022): 1, https://doi.org/10.1016/j.pmedr.2022.101830.
26. Ogundari, “Student Access to Technology at Home and Learning Hours during COVID-19 in the U.S.,” 445.
27. Ogundari, “Student Access to Technology at Home and Learning Hours during COVID-19 in the U.S.,” 443.
28 Casper et al., “The Impact of Emergency Remote Learning on Students in Engineering and Computer Science in the United States,” 704.
29. tiero, “Interior Views of an Empty Japanese-Style Classroom. 3d Render,” iStock, January 31, 2022, https://www.istockphoto.com/photo/interior-views-of-an-empty-japanese-style-classroom-gm1366797961-437228029.
30. Ogundari, “Student Access to Technology at Home and Learning Hours during COVID-19 in the U.S.,” 445.
31. Plank et al., “School Meal Access and Changes in Meal Participation during COVID-19 School Closures,” 2.
32. Plank et al., “School Meal Access and Changes in Meal Participation during COVID-19 School Closures,” 11.